Data That Drives Smarter Conversations

Make smarter decisions with Chattrik's real-time reports track team activity, customer behavior, and chat performance in one place.

Dashboard

Chattrik's intuitive dashboard offers a real-time snapshot of your entire live chat ecosystem. From monitoring active conversations and tracking visitor flow to viewing agent availability at a glance, everything you need is presented clearly in one place. The dashboard is fully customizable, allowing you to prioritize the data that mattens most helping you stay informed and make decisions on the fly.
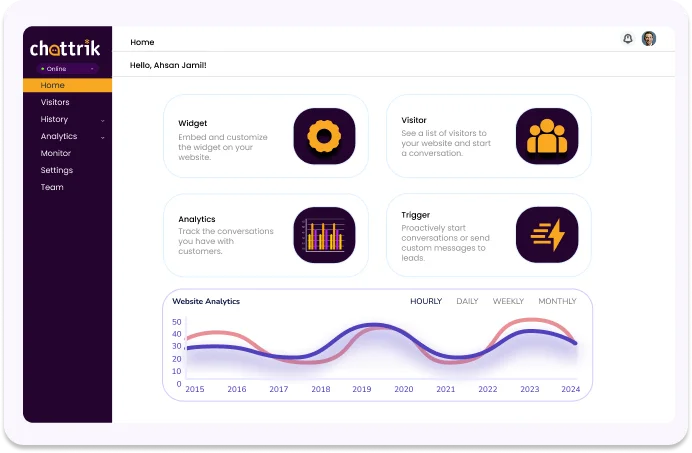
Chattrik dashboard homepage featuring navigation links, a website analytics line graph, and shortcut cards.

Analytics That Matter Most

Whether you're tracking support quality or agent productivity, Chattrik delivers the reporting tools you need to grow smarter and serve better.

Total & Missed Chats

Track chat volume and identify where responses were missed

Performance Trends

Uncover patterns to continuously improve your support strategy

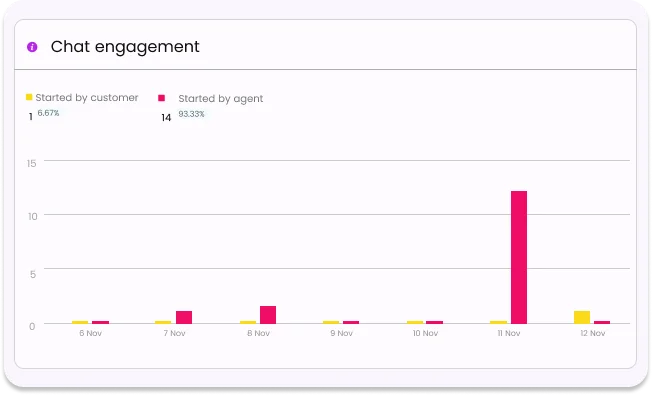
A bar chart tracking chat engagement metrics comparing conversations started by customers versus agents.

Engagement Rates

Measure how effectively your team is engaging with visitors

Chat Duration & Quality

Analyze average chat length and satisfaction scores.

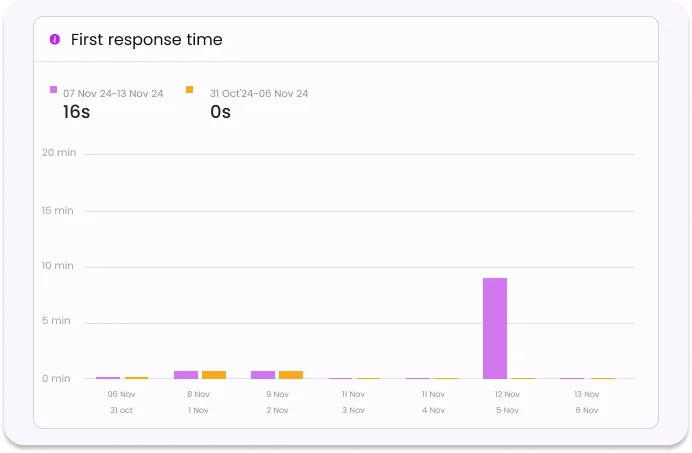
A first response time data chart illustrating agent speed and response intervals over a set date range.

Agent Reports

Chattrik gives you a clear window into individual and team performance with dedicated agent reports. Easily review key metrics like average response time, chat load, and availability to evaluate productivity. Identify your top performers, spot potential bottlenecks, and use the insights to coach your team toward better outcomes.

Customer Reports

Unlock deeper customer understanding through Chattrik's visitor analytics. These reports provide valuable data such as user location, device type, browser, visit frequency, and behavior during chats. With this insight, you can tailor your communication strategies and deliver more personalized experiences that drive engagement.

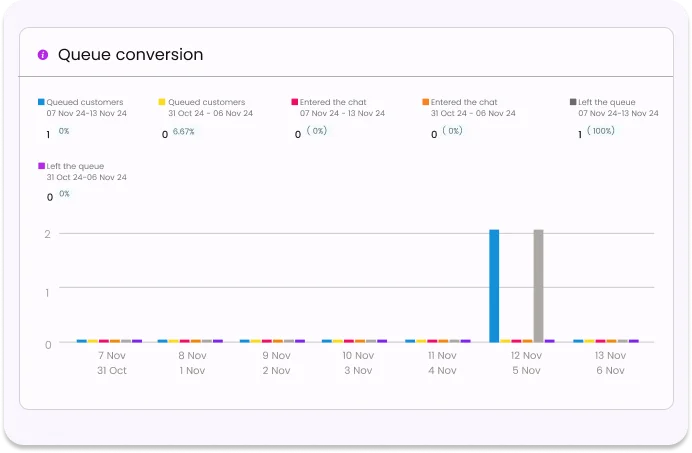
A queue conversion analytics chart tracking customer wait patterns, chat entries, and queue drop-off rates.

Frequently Asked Questions

Have questions? We’ve got answers. Here are the most common things people ask about Chattrik.

Reports & analytics give an overview of your team’s performance, customer interactions, and chats happening within Chattrik.
Response times, chat volumes, team performance, customer satisfaction and many more can be viewed in Chattrik Reports & analytics.
Reports & analytics can help you spot out new trends, identify performance measurement for customer support services and improve the customer support service operations.
Yes, agent individual and group performance are visible through Reports & analytics.
Yes, you can observe what conversations are going in and out within Chattrik through Reports & analytics.
Yes, Reports & analytics are available for you to improve response times and service level agreements.
Key metrics such as number of ongoing chats, new incoming chats etc. Are refreshed regularly.
Yes, you can filter data reports for a date range of your preference.
Yes, you can get information that reflect customer perception of the service quality from Reports & analytics.
Yes, these reports help business make better communication and performance decisions through insights on data.
Yes, Chattrik makes business data simple to digest through user-friendly visual reports.
It equips businesses with actionable data that improve customer support and business efficiency.

Start 30-day free trial at Chattrik

Explore premium chat features, boost support efficiency, and secure your conversations.

WhatsApp Chat